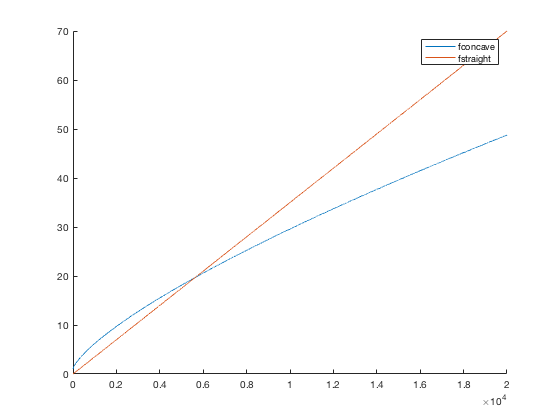
Plotting the constraint equation
This function plots the constraint equation. It separates the constraint equation in 2 parts - the concave and straight line part, their intersection is the root of the constraint equation
it_k_n = 20000;

fl_phi = 1;

fl_alpha = 0.6;
fl_theta = 0.79 -fl_alpha;
fl_kappa = 0;
fl_delta        = 0.1;
fl_r            = 0.04;
fl_w            = 1.8;
fl_R            = fl_r + fl_delta;
fl_ahi          = 100;

fl_a = 1;
fl_z = 1;

ar_k = linspace(0, 5*fl_ahi, it_k_n);  % Grid of capital to search for roots of constraint equation (order = 1 X it_k_n)

f_lmax= @(z,k) (fl_w./((k.^fl_alpha).*fl_theta.*z)).^(1/(fl_theta - 1)); % max l for a given constrained k

f_con_concave = @(a,z,k) fl_phi.*((k.^fl_alpha).*z.*(f_lmax(z,k)).^fl_theta - fl_w.*(f_lmax(z,k)))-(1+fl_r)*fl_kappa.*ones(numel(a),it_k_n)+(1+fl_r).*(a).*ones(1,it_k_n);
    % concave part of the constraint function

f_con_straight=@(a,z,k) (1-fl_phi).*(1-fl_delta).*ones(numel(a),1).*k+fl_R.*ones(numel(a),1).*k;
    % straight line part of the constraint function

f1 = f_con_concave(fl_a, fl_z, ar_k);
f2 = f_con_straight(fl_a, fl_z, ar_k);

figure(1)
hold on
a1 = plot(f1); M1 = "fconcave";
a2 = plot(f2); M2 = "fstraight";
legend([a1,a2], [M1, M2]);
hold off
saveas(gcf, '/Users/sidhantkhanna/Documents/GitHub/BKS modified/code/Firms/figures/con_kl/plotconkl.png')
